The HackDiet manual
Generated against the shipping iOS source — every count, label, and constant on this page is bound to a machine-extracted facts file, so prose can't drift.
This is the illustrated guide to every screen, value, and behaviour in HackDiet on iPhone. Pick a chapter from the sidebar, or scroll through. Looking for the underlying math? The methodology page covers the EMA recurrence, the OLS regression, the 7716 kcal/kg constant, and the framing decisions (weeks-of-math, no calendar dates).
Welcome #
HackDiet is a quiet, trend-focused weight tracker. You weigh once a day; the app draws an exponentially-smoothed line through every reading you've ever logged. That line is the answer to "is what I'm doing actually working?" — without the daily ±1 kg static.
Three things HackDiet is not:
- Not a calorie tracker. Calorie counting is bookkeeping; the weight trend is the result.
- Not a social app. No leaderboards, no shared streaks, no support communities to perform for.
- Not a subscription. €4.99 once. No ads, no upsells, no in-app purchases.
First launch #
The first-run flow is a single screen: the wordmark up top, a one-line lede, a unit picker (kg / lb / st — defaulted to your locale), and two ways to start.

The two start choices are:
- Import data — opens the universal importer (CSV from MyFitnessPal / Withings / Libra, an Apple Health
export.zip, or a Hacker's Diet XML — see Import). - Start fresh — begins with an empty log; you can always import later from Settings → Data → Import data.
Core concepts #
Weight, trend, plan
Three values appear over and over in HackDiet — make sure they're clear:
- Weight is the raw number from the scale on a given day. It's noisy (±1 kg overnight is normal). HackDiet shows it as a blue dot per logged day on the chart.
- Trend is the exponentially-smoothed line through every weight you've ever logged. It's the answer to "is what I'm doing actually working?". Most numbers in the app are computed from trend, not raw weight, because raw weight is too noisy to draw conclusions from.
- Plan is your declared intent: lose to X kg, gain to Y kg, or maintain inside band L–H kg. The plan drives the weeks-to-goal projection and the on-track / off-track signal.
The trend is what you watch
The trend is computed via the recurrence trend = trend + (weight − trend) × 0.1 on every logged day. The smoothing constant α = 0.1 is John Walker's original choice in The Hacker's Diet. Days you didn't log don't change the trend. The methodology page walks through the math in detail.
Walker's 7716 kcal/kg constant
Whenever HackDiet talks about "implied daily kcal balance" it's translating a weekly weight rate into kcal/day via Walker's ~7716 kcal-per-kilogram-of-body-mass approximation: kcal/day = (kg/wk × 7716) ÷ 7. Negative is a deficit; positive is a surplus.
The Today screen #
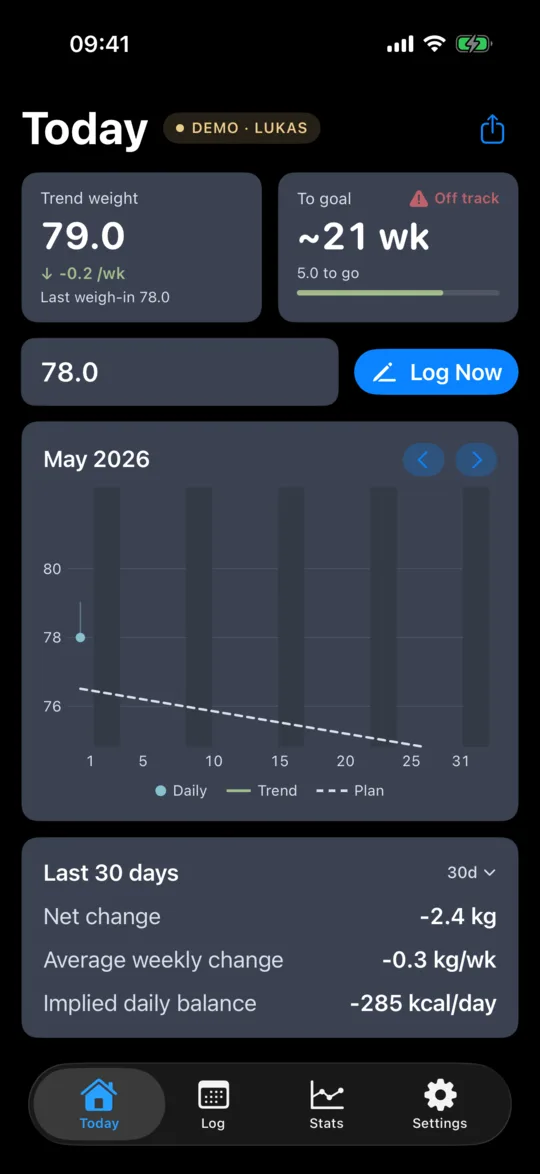
The Today screen is the hot path: glance at the trend, glance at the goal status, log today's weight, see this month's chart. From top to bottom:
Trend weight tile (top-left)
- Hero number — today's trend value in your display unit, or an em-dash if no trend exists yet.
- Weekly delta sub-line — a signed change like "−0.5/wk" with an up/down/flat arrow. Tinted red (gaining), green (losing), or muted (flat). Computed as
currentTrendKg − trendKg(7 days ago). - Last weigh-in line — the raw
weightKgof your most recent logged day. No smoothing, just the value you typed.
To goal / Maintain tile (top-right)
This tile adapts to the active plan's goal type — Lose, Gain, or Maintain. All three render a plan-status pill in the header: a small icon with one ofOn plan, Ahead, Behind, Off track — colour-coded so the at-a-glance read is unambiguous.
Lose / Gain plans render an ETA hero (e.g. "~10 wk"), a kg-to-go sub-line (|currentTrend − goalWeight|), and a linear progress bar from start weight to goal weight. The hero adapts to the situation — possible secondary lines include"Goal reached", "past goal", "Pace stalled", "Trend moving away from goal", "to go". When the trend isn't moving toward the goal, the ETA collapses to a dash with the relevant explanation underneath.
Maintain plans render"In band" / "Above" / "Below" as the hero, the configured band as a sub-line, and a horizontal band strip with a marker dot at the trend's current position.


Log row
Two states. Not logged today: an input pre-filled with your most recent logged weight, plus a Log Now button. Logged today: a status line ("Logged today: 78.0") with an Edit button that flips back to the input state.
Pre-filling the most recent value means the hot path "same as yesterday" is one tap. The widget version of this is the small home-screen widget — see Widgets.
Monthly chart card
Same chart as on Log. See Chart elements for what each visual element means. The header shows the visible month with prev / next chevrons. Drag a finger across to scrub a vertical line; the annotation balloon shows the day's weight and trend.
Period stats card
Period selector menu at top-right with options 14, 30, 90 days. 3 rows, all computed from trend values, not raw weights:
- Net change —
last.trendKg − first.trendKgacross the window. - Average weekly change — ordinary least-squares regression slope of
(daysSinceFirst, trendKg)× 7. - Implied daily balance —
(kg/wk × 7716) ÷ 7kcal/day.
The Log screen #

Calendar grid
One cell per day of the visible month:
- Today — solid fill, inverse-coloured day number. Always the most prominent cell.
- Logged days — full-opacity day number, the weight value rendered in your display unit, plus a small dot below the day number.
- Un-logged days — faded day number, no weight, no dot.
- Flagged days — additionally marked with a yellow star. Set the flag from the Day Editor (next).
Tapping any cell opens the Day Editor sheet to set/edit the weight, the flag, and a free-text comment.
Monthly chart card
Same chart as on Today. See Chart elements.
Editing a day #
Tapping a day cell on the Log screen opens the Day Editor as a half-sheet:
- Weight — decimal pad. Validation: hard reject outside 20–500 kg (silently impossible for an adult), soft confirm in the outer band 35–250 kg. Edits to historical days are also nearest-neighbor checked: the threshold scales as
max(5 kg, 5% × neighbor, 0.2 kg/day × gap), so short-gap edits land on the 5 kg floor while long-gap edits ("life happened, a holiday, an illness") get more room before flagging. - Flag this day — toggle a star on the day. Useful for marking "scale at the gym" or "first day of the month" — whatever you want.
- Notes — free-text comment. Stored alongside the weight, exported in XML, displayed in the day-editor when you reopen.
- Delete — destructive. Removes the day from the log; subsequent trends are re-walked.
Home-screen widgets #
Three iOS widgets ship in HackDiet. Add them from your home screen's edit mode (long-press the home screen → tap the + in the corner → search for "HackDiet").
- Small widget — today's trend value, the weekly delta, and a one-tap "Same as yesterday" button. The button writes today's log entry as your most recent logged weight; the widget refreshes within seconds.
- Medium widget — a 30-day sparkline of the trend plus the latest trend value, with an "Open log" button to jump straight into the Log screen.
- Large widget — same headline + sparkline as the Medium, plus an interactive
−/+nudge row and an explicit "Log" button. Tap−or+to adjust today's draft weight in0.1 kg,0.2 lb, or0.5 lb (≈ 0.04 st)steps (depending on your unit preference); tap Log when you're happy with the draft. Until you tap Log, nothing is written — over-tapping is recoverable by tapping the opposite button.
All three widgets read from a JSON snapshot the app writes to the App Group on every save, so they update silently as you log.
Privacy mode (small + medium widgets)
Long-press the small or medium widget → Edit Widget → Privacy. Two options:
- Show numbers (default) — today's trend weight + 7-day delta visible. The original behaviour.
- Discreet — replaces the headline with a rate-of-change label (e.g. ↓ 0.4 kg/wk). No absolute body weight is shown anywhere on the widget. The sparkline (medium) still renders, but it never carried axis values, so what leaks is the shape of the trend, not the numbers. Useful when you'd rather not have your weight glanceable to anyone who picks up your unlocked phone.
The large widget does not offer privacy mode — its − / + nudge buttons need a visible draft value to be useful. If you want a discreet widget, choose the small or medium size.
Window-length aside. The Today screen's monthly chart shows the 28-day rolling window ("Past 4 weeks"); the widget sparkline shows the last 30 trend days. Both rolling, both honest — the slight asymmetry exists because 28 days lines up neatly with four weekly tick marks on the in-app chart, while the widget sparkline benefits from the extra two days of context.
Stats → History #

Window picker
Segmented control with 3M, 6M, 1Y, All. Filters every value on the page. All runs from your earliest logged day to today.


Chart
Long-range trend over the chosen window. Same vocabulary as the monthly chart (see Chart elements) plus zebra month shading: every other calendar month gets a soft tinted band so the chart reads as month-segmented at a glance.
Summary card
Same 3 values as the Today period-stats card, computed over the selected window: net change, average weekly change, implied daily energy balance.
Stats → Analysis #

Window picker
Menu with 14 days, 28 days, 90 days. Sets the regression window for everything below.
Trend weight over the last X (results card)
- Weekly change — OLS slope × 7. Tinted red if positive, green if negative, neutral near zero.
Details card
The remaining rows, all derived from the regression:
- Current trend weight — the most recent day's
trendKg. - Distance to goal —
|currentTrend − goalWeight|, signed in the direction the user is moving. - At this rate — projected weeks to reach the goal at the current slope.
weeks = (goal − currentTrend) ÷ slope ÷ 7, expressed as "less than a week" if < 1, otherwise "~N week(s)". Sanity-bounded at 5 years; shown as—when the slope isn't moving toward the goal. - Trend slope — the OLS slope expressed in display unit per week. Secondary metric — the absolute size of what's driving "At this rate".
If the math doesn't converge (the "At this rate" row is a dash), an additional sentence reads "Your trend isn't moving toward your goal yet. Adjust the plan or give it more time."
Stats → Calculator #


The Calculator is a what-if helper. You set two inputs and the calculator solves for the third, then expresses the daily kcal balance the rate implies.
Mode picker
- Pick a rate — set Target weight + Time-to-goal; the calculator solves for the required weekly Rate.
- Pick a duration — set Target weight + Rate; the calculator solves for the implied Time-to-goal.
Inputs
Each input has both a slider (for quick browsing) and a tap-to-edit value text (for precise entry). Tap the value next to the slider's label to type an exact number; Set applies it, clamped to the slider's range. Slider step adapts to your display unit so increments read clean.
- Target weight — range adapts to current weight (floor 30 kg, −60 to +30 around current). Step:
0.5 kg/1 lb/0.1 st. - Time to goal — 2 to 104 weeks, 1-week steps. Editable only in Pick a rate mode.
- Rate — 0.05 to 1.5 kg/wk underlying. Step:
0.05 kg/wk/0.1 lb/wk/0.05 st/wk. Editable only in Pick a duration mode.
Outcome card (hero)
- Hero number:
- Pick a rate mode: required weekly rate, e.g. "0.50 kg/wk".
- Pick a duration mode: implied weeks-to-goal, e.g. "~12 weeks" or "less than a week".
- kcal/day sub-line:
(rate × 7716) ÷ 7, signed. Tinted green for a deficit, red for a surplus, neutral for maintenance. Labelled "Deficit", "Surplus", or "Maintenance".
Commit as my plan
Archives the current active plan into Plan history with a "committed_at" timestamp, then writes the calculator's result as the new active plan. The Plan history link sits below the commit button and lets you revert.
Plan types #
3 plan types. Pick whichever matches your intent:
- Lose — set a target weight below your current trend and a weekly rate (negative kcal balance). The Today tile shows weeks-to-goal and a progress bar.
- Gain — same shape as Lose, in the other direction. Useful for rebuilding after illness or following a training program where you want a steady, modest gain.
- Maintain — set a target band (low–high). The Today tile shows whether the trend is in band, and how far above / below if not.
Plan wizard #

Reached from Settings → Diet plan → Edit plan. The wizard is a 3-step flow:
- Where you are — confirms your current trend weight and asks for height if it isn't set yet (height is optional, but enables a live BMI badge in step 2).
- Where you want to be — pick the goal type (Lose / Gain / Maintain) and the target weight (or band, for Maintain). If you've entered your height, a small BMI badge sits next to the slider so you see roughly which category the target falls into.
- How fast — only for Lose / Gain. Pick a rate from the presets or roll your own with a custom slider.
The "How fast" step offers 4 preset cards:
- Gentle — ≈ 0.25 % bodyweight per week. Most sustainable; least likely to feel like a "diet".
- Moderate — ≈ 0.5 % per week. The default — the rate the wizard pre-selects.
- Aggressive — ≈ 0.75–1 % per week. Faster but harder to hold; the wizard surfaces a gentle warning.
- Custom — pick any rate via a slider. Useful if a preset doesn't quite match what you want.
Plan history #
Every time you commit a new plan via the wizard or the Calculator, the previous plan is archived with a timestamp. Plan history is reachable from a link directly under the Calculator's commit button (Stats → Calculator); each row shows the prior plan's targets and the date it was committed, with a tap to revert. Useful if you tried something aggressive for a few weeks and want to dial back.
Apple Health #
HackDiet supports two independent Apple Health features, both opt-in. From Settings → Apple Health:
- Sync with Apple Health — when on, weights you log here write to Health, and weights from connected scales appear here. Latest sample wins; manual entries always beat imported ones; HackDiet's own write-backs never re-import as duplicates (we tag them with a metadata marker).
- Import history from Apple Health — a one-shot operation. Pick a date range, import every body-mass sample in that range. Doesn't enable ongoing sync.
- Learn about Apple Health — opens the long-form policy page (also at /help/healthkit).
The full policy (the seven manual-wins / fills-empty-days rules, what we read, what we write, what we never touch) is at /help/healthkit.
Notifications & reminders #
Everything is local-only — no servers, no push topics. From Settings → Notifications:
- Gentle log reminders — local notifications that decay through 30 hours → 3 days → 7 days → stop, anchored to your last log. Resets when you log again.
- Trend alerts — fire only when the trend stays outside the goal band (or moves the wrong way) for a full week. Never on single-day spikes. Cooldown of 7 days between fires.
- Pause until — silences both notification types until the chosen date. Auto-resumes on that date. Useful for holidays.
Share progress #
Reached from Settings → Data → Share progress (and from a small share-sheet button on the Today screen header). Generates a shareable image card from your current data. Pick:
- Card type — Today / Period / Milestone.
- Period (only for the Period card) — Last 30 days / Last 3 months.
- Aspect — square (1080×1080 in v1; landscape and story aspects are a candidate for a later release).
Theme is auto-derived from the app's color scheme; not user-selectable in v1. The card renders locally and goes through the standard iOS share sheet. Disabled until there's enough data to render a meaningful card.
Import #
Reached from Settings → Data → Import data (also offered during onboarding). One sheet, format auto-detection. 6 sources are recognised:
- Apple Health — the
export.zipfrom Health → Profile → Export All Health Data. Body-mass samples only. - Hacker's Diet (XML) — the fourmilab format. Round-trips: import this file, export it again, the two are byte-identical except for the export timestamp.
- Libra — the Android trend-weight tracker. CSV export.
- MyFitnessPal — CSV export from the website.
- Withings — CSV from the data-export tool.
- CSV — heuristic fallback for any other CSV: looks for a date column and a weight-shaped numeric column, rejects body-composition columns (fat / muscle / lean / BMI / etc.) by header keyword.
2 commit modes:
- Merge (default) — upserts every row. On a same-day collision, the imported value wins.
- Replace — wipes all existing data first, then imports. Only on this path does the "Also import diet plan + preferences" toggle take effect (for fourmilab XML).
If your store is empty (e.g. fresh install), the UI collapses to a single "Import N entries" button instead of the merge/replace pair.
For the full migration playbook — including how to export from each source app — see the switching guide.
Export & backup #
Settings → Data → Export Data (XML) writes a fourmilab-compatible XML export to a temp file and opens the iOS share sheet. The export round-trips: import this file into another HackDiet install (or fourmilab) and the data is identical, including imported-but-not-shown fields like the rung exercise metric.
Beyond manual exports, your full data is included in iCloud device backups (the default on iOS) — restoring a backup restores HackDiet exactly. We do not use CloudKit for live sync; the data is local-only.
Demo mode #

Settings → Data → "Try sample data" opens the persona picker. 12 personas ship with the app, ordered to put the success-flavoured arcs first so a new visitor's at-a-glance impression is optimistic:
8 months of steady loss
Lost, plateaued, slowly drifted up
Two years steady, ±1 kg
Lose-then-maintain, 18 months
Bulk-and-cut over 14 months
Slow, steady gain
Recovery curve, currently above goal
Gaps, outliers, plan changes
Six weeks of logging, planner empty
Lost most of it, last 7 lb won't budge
Three years of stable weight, sparse logger
Three weeks of data, getting started
Demo mode swaps to a separate SQLite store; your real data is bit-untouched while you're in demo. A small DEMO · NAME pill appears on every page header as the exit affordance — tap it to flip back. Widget snapshots, HealthKit pulls, and Apple Health write-backs all skip in demo mode (your real numbers stay on the home-screen widget regardless of which mode the app is in).
Erase all data #
Destructive. Settings → Data → Erase all data wipes weights, the diet plan, plan history, and preferences. Re-presents the onboarding flow on next launch.
If you also want to clear HackDiet-written samples from Apple Health, the alert offers an "Erase + clear Health" destructive option; this deletes only the body-mass samples HackDiet itself wrote (we never touch samples from other sources). The "Erase only" option leaves Health untouched.
Chart elements #
The same vocabulary applies to the monthly chart (Today, Log) and the long-range chart (Stats → History), with minor visual differences for scale.
Daily weight dot
One filled circle per logged day, at (date, raw weightKg). Yellow when the day is flagged with a star. The "floats" of "floats and sinkers" — the dots float on the noise.
Trend line
A solid green line through the EMA-smoothed trend values. Cuts off after the latest logged day so unlogged trailing days don't render a flat tail. See the EMA section of the methodology page for the recurrence.
Drop lines (the "sinkers")
Thin vertical line per logged day, from the daily weight dot to the trend line. Visual cue: this is the difference between today's weight and today's underlying trend.
Plan line (dashed)
Rendered only when a plan is active and "Show plan line on chart" is on (Settings → Diet plan).
- What it shows — the projected weight at every day from the plan's start date forward, given the plan's slope.
- How it's calculated —
plannedKg(date) = startWeightKg + (calorieBalance ÷ 7716) × daysSincePlanStart. - Y-domain handling — the chart auto-scales to fit your weight + trend data. The plan line is allowed to soft-expand the scale by up to 50% of the data range; beyond that it gets hard-clipped (off-domain plan points are dropped) so a far-off goal can't squash today's data into a flat strip at the bottom.
Weekend bands (monthly chart only)
Soft column shading on Saturdays and Sundays. Helps you spot weekly rhythm in the dot pattern (e.g. weekend bumps from food/drink).
Zebra month shading (history chart only)
Every other calendar month in the visible window gets the same soft tint as the weekend bands. Lets you read month boundaries at a glance without explicit divider lines.
Y-axis
Integer ticks in your display unit, no per-tick unit suffix (the unit was chosen at onboarding; you know what you're looking at). Tick density target is 4 ticks (per the niceTicks heuristic), so the y-axis reads as a reference grid rather than a wall of numbers.
X-axis
Day numbers on the monthly chart (1, every-5th, last-day-of-month). Auto-formatted dates on the history chart. No vertical gridlines — segmentation is handled by the weekend / zebra shading.
Sparse-month guard (monthly chart only)
When the current month has fewer than 7 logged weights, the chart's y-domain is extended to include the previous month's weight + trend range. Without this, a 2-point month would auto-zoom to a tiny range (0.4 kg) and read as dramatic. Prior-period values aren't drawn — they only widen the scale.
Touch-drag scrubber
Drag a finger across the chart to land a vertical scrubber on the calendar day under your finger. The annotation balloon shows that day's weight and trend value (or "no data" if the day wasn't logged). Selecting a logged day adds a soft glow behind the dot and triggers a selection haptic each time the scrubber crosses to a new day.
Settings #
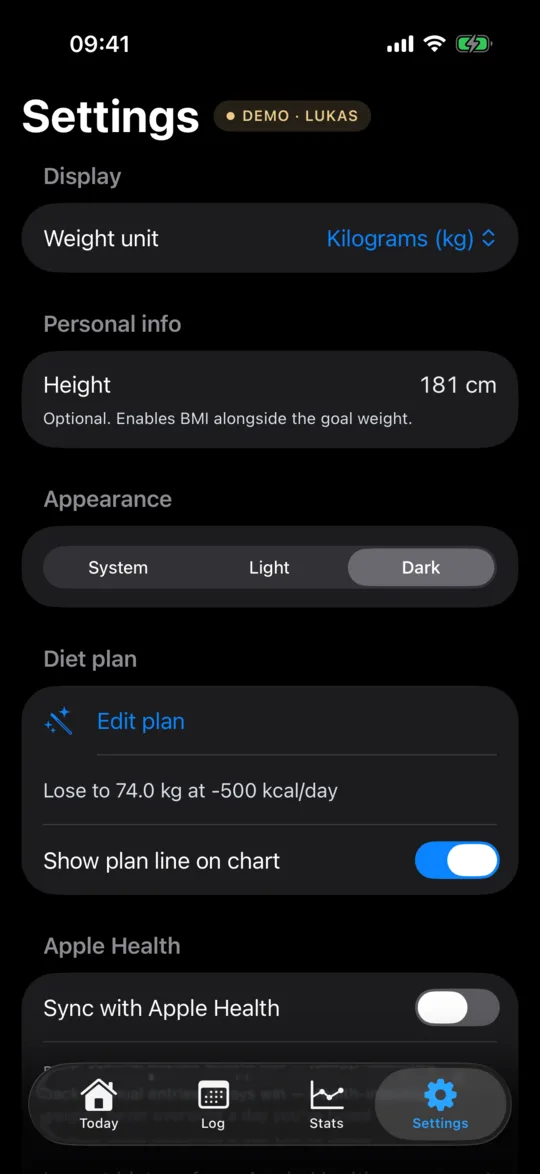
The Settings screen lays out 8 sections in this exact order: Display → Personal info → Appearance → Diet plan → Apple Health → Notifications → Data → About.
Display
- Weight unit — kg / lb / st. Updates both the display unit and the log unit (the unit your text fields expect when you type).
Personal info
- Height — optional. Used by the Plan Wizard's BMI badge that sits next to the goal-weight slider so you see roughly which category the goal falls into. Stored in centimetres internally; displayed as cm or feet+inches per your unit pref.
Appearance
- Theme — System / Light / Dark. See the Appearance chapter for a side-by-side comparison.
Diet plan
- Edit plan — opens the Plan Wizard.
- Show plan line on chart — toggle. When on, the dashed plan line renders on the monthly chart (and feeds the soft-expand y-domain logic — see Chart elements).
Apple Health
- Sync with Apple Health — the ongoing two-way sync. See Apple Health.
- Import history from Apple Health — one-shot date-range import. See Apple Health.
- Learn about Apple Health — opens the policy page.
Notifications
- Gentle log reminders — see Notifications & reminders.
- Trend alerts — see Notifications & reminders.
Data
- Share progress — opens the share-card flow. See Share progress.
- Import data — universal importer. See Import.
- Export Data (XML) — fourmilab-compatible export. See Export & backup.
- Try sample data — Demo mode. See Demo mode.
- Erase all data — destructive. See Erase all data.
About
- About HackDiet — the App Store-facing About page: version, attribution, methodology summary, links to the methodology and back to this manual, intended-purpose disclaimer.
Appearance #
The Theme picker (Settings → Appearance → Theme) is System / Light / Dark. System follows iOS — both themes ship as first-class layouts. Here's the same Settings screen rendered side-by-side so you can see the actual contrast pair:
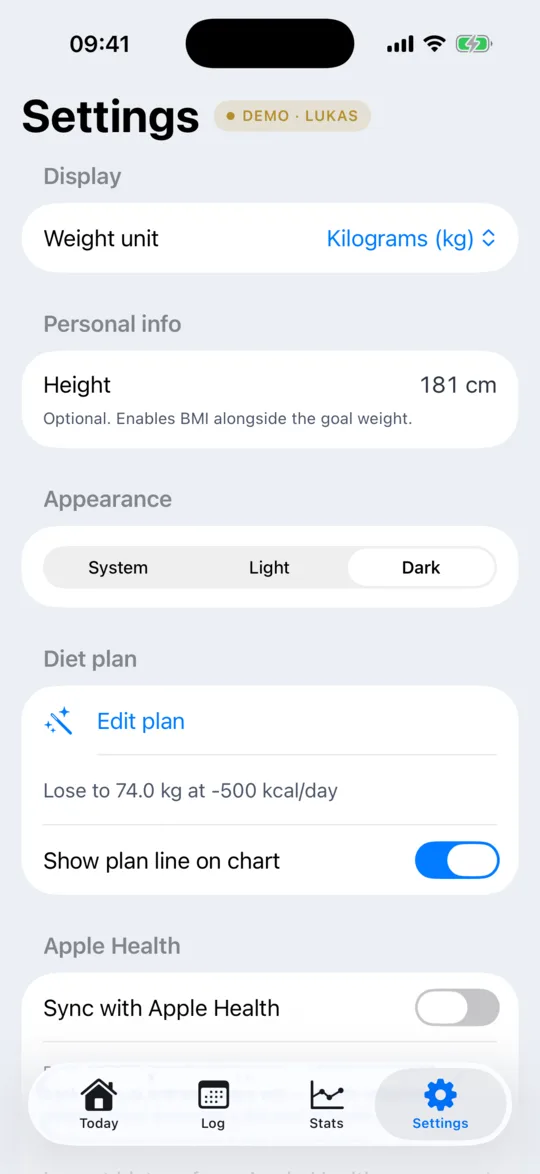
Every screen in the app — Today, Log, Stats, Plan wizard, share cards — is themed against the same palette. The System default flips at sunset / sunrise on most iPhones; pick Light or Dark explicitly to pin the appearance.
FAQ & troubleshooting #
The trend is flat but my weight clearly went down — is something broken?
Probably not. The trend lags raw weight by design — that's the noise-cancelling part. A single low day moves the trend by 10% of the gap; you need three or four similarly low days in a row before the trend visibly turns.
The Today screen says my goal is "—" weeks away. What does that mean?
Your trend isn't moving toward the goal yet (e.g. you're on a lose plan but the trend is flat or trending up). Rather than show a misleading number, HackDiet hides the projection until the slope is in the right direction. Analysis will say the same in plain prose.
I logged a wrong number — how do I fix it?
Log screen → tap the day cell → edit or delete. Subsequent trends are recomputed automatically.
My Apple Health values aren't appearing.
Two things to check: (1) iOS Settings → Privacy & Security → Health → HackDiet — both Read and Write should be enabled. (2) HackDiet's Settings → Apple Health → Sync with Apple Health needs to be on for ongoing imports. The full policy is at /help/healthkit.
How do I move my data to a new phone?
iCloud device backup carries HackDiet's data along with everything else, so a fresh restore on a new phone Just Works. If you'd rather migrate explicitly: Settings → Data → Export Data (XML) on the old phone, then Import on the new one.
Can I run HackDiet on iPad?
It runs in iPhone-compat mode on iPad — the iPhone layout, scaled. A native iPad layout isn't on the v1 roadmap.
Where's the watchOS app?
Not in v1. We considered a watch complication for the small-widget metrics; it's a candidate for a later release if there's clear demand.
See something this manual doesn't cover, or a value that doesn't match what's on screen? Email support — keeping this page exact is the goal. The page renders against a machine-extracted facts file, so most categories of drift are caught automatically.